To monitor enrolled participants and download their data, you need to log into the Insights Dashboard: http://insights.hyfe.ai/. To sign in, enter your email address. You will be sent an email with a link to access the dashboard.
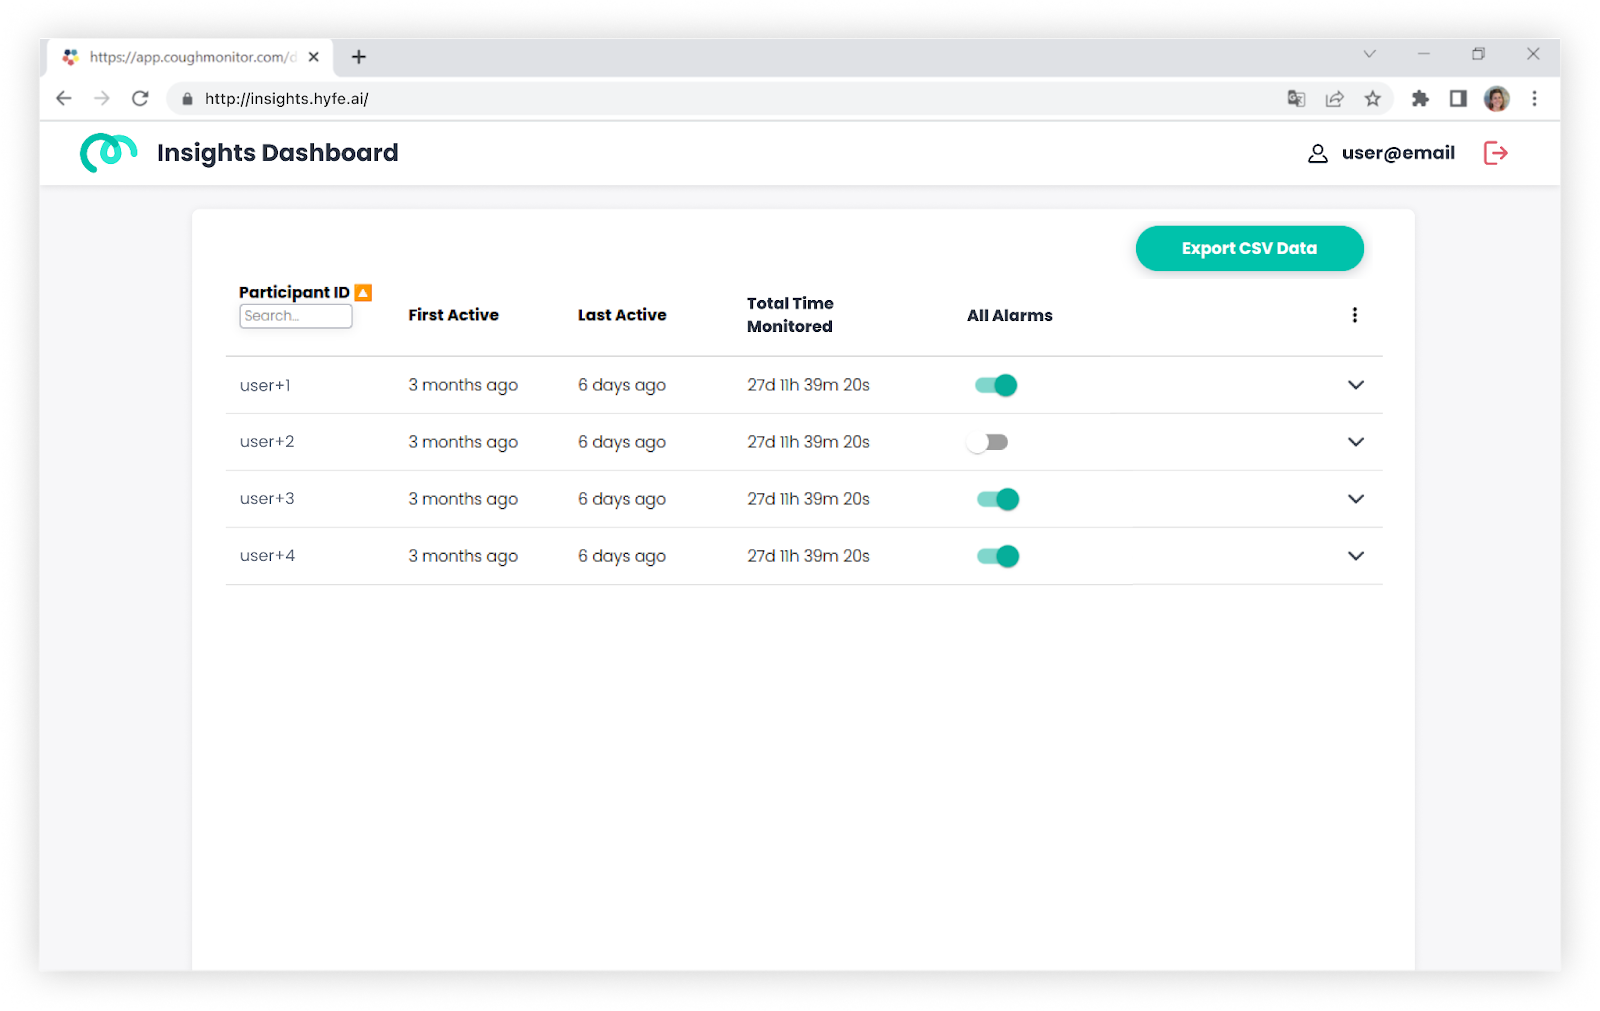
- Visualize data at the cohort level: You can explore data at the cohort level by checking the following columns:
- Participant Hyfe ID
- First Active: first cough event (timestamp) sent to Hyfe’s Cloud
- Last Active: last cough event (timestamp) sent to Hyfe’s Cloud
- Total Time Monitored: total time that the CoughMonitor has been monitoring
- All Alarms: each alarm/ reminder that the study has chosen to use
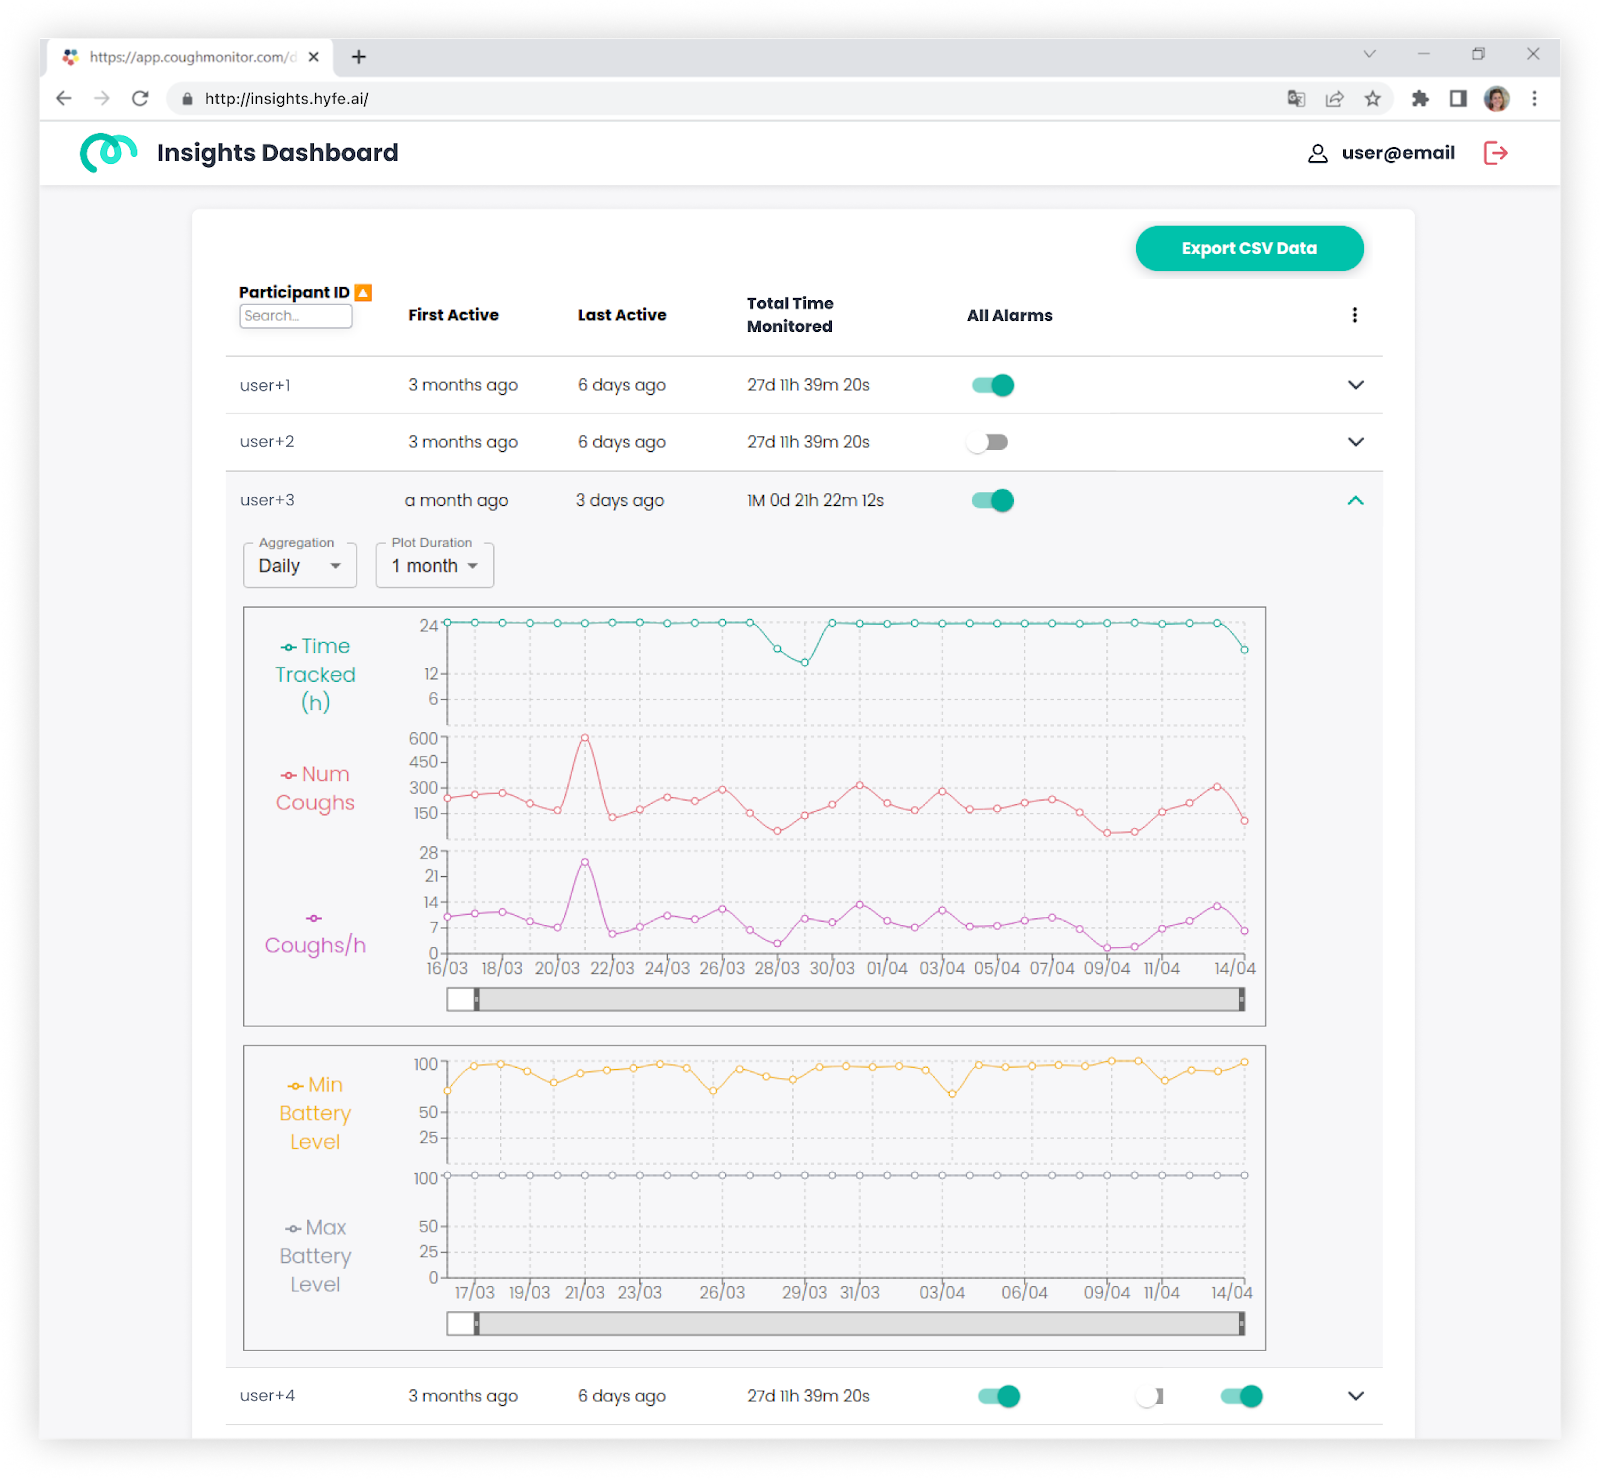
Visualize data at the participant level:
Click on the arrow located on the far right column of each row containing a participant, and use the following two dropdown menus to personalize data presentation:
- Aggregation: Choose the time interval or level of detail.
- Plot duration: Select the period for which you want to view data.
Once you have selected the level of aggregation and period, the following data will be displayed:
- Time Monitored: Shows the duration the CoughMonitor has been actively monitoring, in hours.
- Num Coughs: Shows the total number of coughs recorded.
- Coughs per Hour: Indicates the average rate of coughs per hour.
- Minimum Battery Level: Displays the lowest recorded battery level.
- Maximum Battery Level: Shows the highest recorded battery level
By hovering your cursor over any given day, specific data for that date will be displayed.
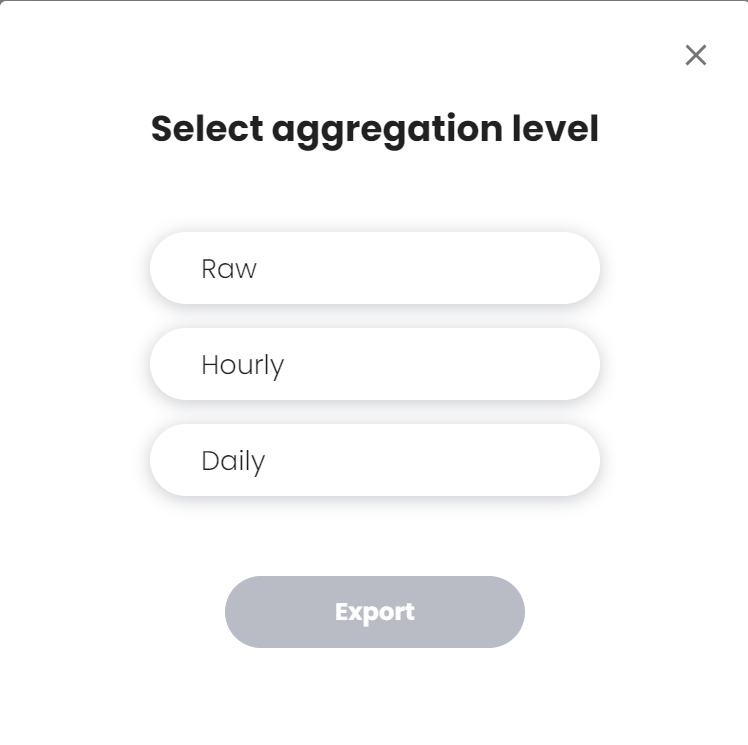
Export Data:
To export data, click “Export CSV Data” in the upper right side of the Insights Dashboard. You can export aggregated data in 3 formats: Raw, Hourly or Daily. Once you select an aggregation level and click “Export,”, a CSV file will be downloaded to your computer containing data from each cohort participant. If you have chosen to include the Monitoring Diary or Cough Questionnaire in your study, this data will also be included in the downloaded CSV file.